
Navigating the Portal
This page shows you how to browse, filter, and download data from the ALS Knowledge Portal using the Explore tab. You’ll learn how to use filters, interpret visual summaries, navigate tables, and access the data you need, whether directly from the site or via programmatic tools.
Are all data on the portal equally accessible?
Anyone can browse public content on the ALS Knowledge Portal, but you need a Synapse account in order to download data. Register for an account here.
In addition, some data requires additional information to access. Review the Data Access section to learn more.
Explore the Data
All data stored in the system will appear in Portal pages under the Explore tab. In the Explore tab, the various sub-tabs correspond to how the data is categorized for filtering purposes. To demonstrate how to find data of interest, let’s look at the Datasets subtab.

Note: The data and numbers shown in the screenshot reflect the portal at a specific point in time. Values may differ when you explore the portal, as it is continuously updated.
Apply Filters
In the image shown above, the table and associated graphs incorporate the total files stored. Available Filters, on the left of the screen, is broken into sections that will differ depending on the subtab that you’re exploring. See the image and bullet points below for a step-by-step explanation.

On the Explore tab, open the section you want (e.g., Datasets).
Click the + next to any filter category to expand it (blue rectangle).
Each filter label shows how many items will be included. Select the ones you need (purple arrow).
Scroll and click Show more to view all filtering options (orange oval).
Chosen filters appear under the visual charts. You can remove filters individually or click Clear All to start fresh.
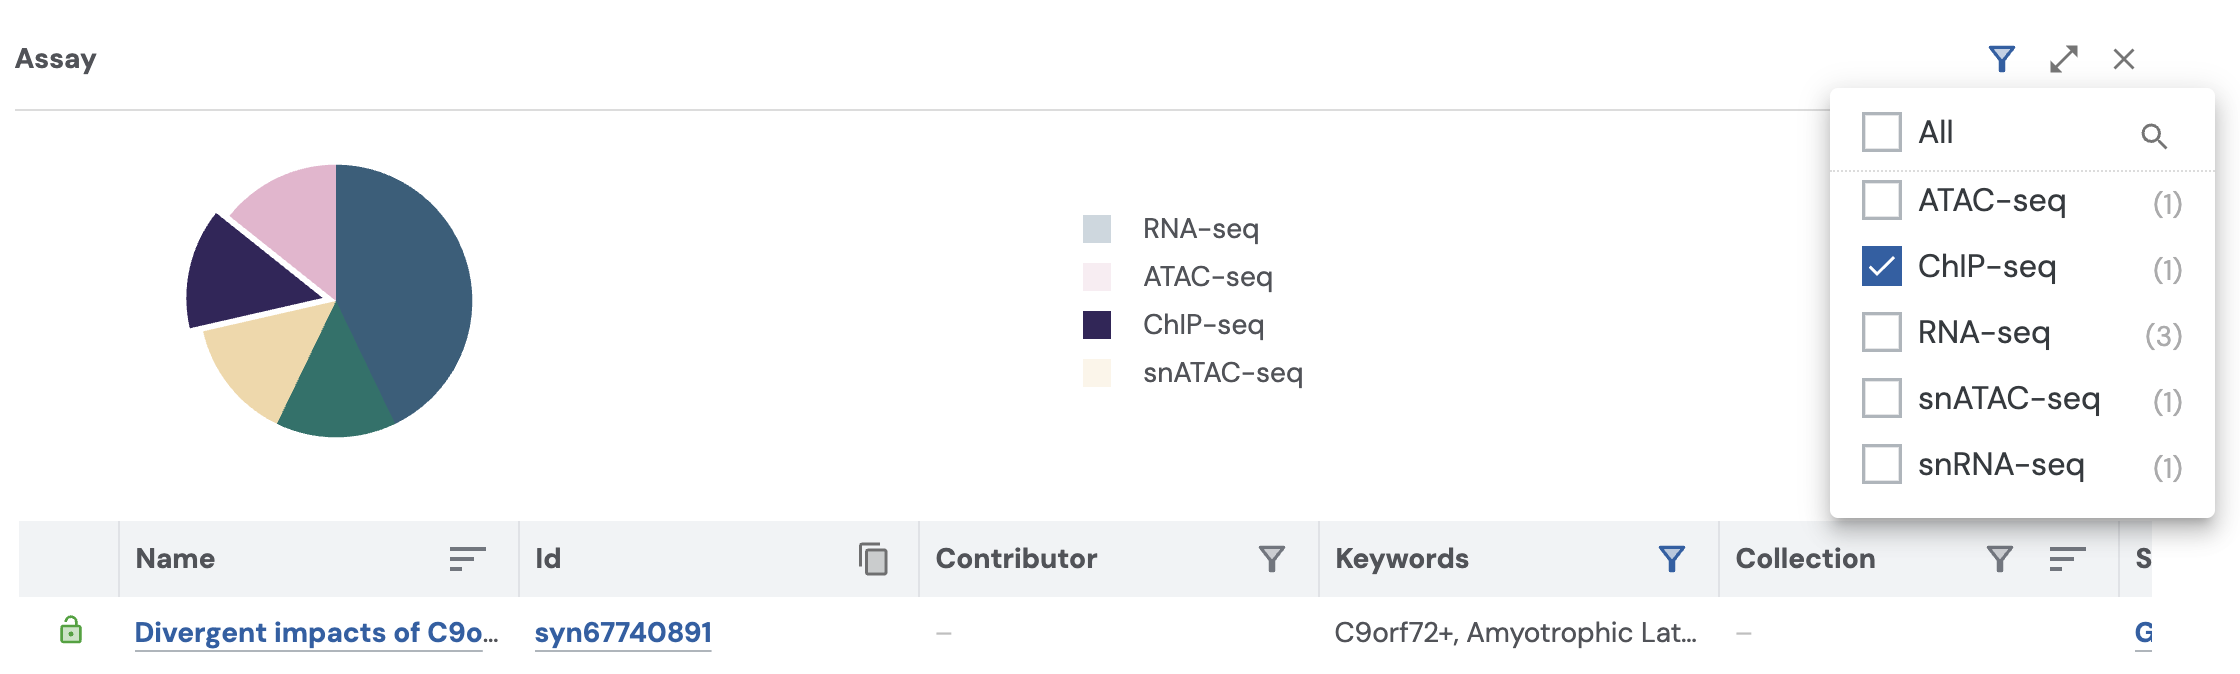
Interpret Visuals

Filter: Click to adjust the filters for that category.
Expand: Click the expand icon to enlarge a chart.
Remove: Click the X to hide a chart.
Navigate the Data Table
The data that you’ve filtered for will appear in the data table below the visualizations section. Notice how it’s organized by category.

Reorder icon: Click to sort the table by that category (click again to reverse the order).
Copy icon: Click to copy file IDs to your clipboard.
Filter icon: Click to apply filters for that category, just like using the filters at the top of the page.
Note: The table fits 25 rows of data. Click Next or Previous to shuffle through more rows as needed.
Customize Your View (settings)
At the top of the page, above the visualization section, there are several icons you can use to adjust the page settings. From left to right:

Search icon: Type in a keyword to quickly find what you need without scrolling through all filter categories. You can also choose a specific category to search within. Click the icon again to close the search bar.
Clipboard icon: Copy your search results to your clipboard with one click.
Graph icon: Show or hide the data visualizations.
Download icon: Export the table you’re viewing as a .csv or .tsv file.
Click Add to Download Cart to save the table for later download directly from the portal.
Or choose Programmatic Options to download the table using the Synapse command-line client.
Columns icon: Add or remove columns to customize the table view.
Download Data
From the UI:
After filtering and confirming you have access to the data, click the Download Options icon.
Select Add to Download Cart from the menu. If prompted, choose Add all files.
Wait a few seconds for the files to queue. A shopping cart icon will appear in the top-right corner showing the number of files.
Click the cart and select Download as .zip packages.
Note: The Synapse web interface supports up to 5 GB or 100 files per download session.
Programmatic Download:
You can also download data using Python, R, or the command line. This option requires some technical setup, but step-by-step instructions are available in the Synapse Docs: Downloading Data Programmatically.
Quick Tips
Here are a few tips to help make the most of your data exploration:
Exact terms only. Our search isn’t forgiving of typos.
Click program or study name to see more details.
Use visual summaries in any Explore tab to understand available data.